On Saturday evening, the Bitcoin book took a hit large enough to make its nearest bids almost disappear.
Between 20:54:10 and 20:54:20 UTC on 14 November, aggressive sellers were net sellers of about $19.09 million on Binance Spot. In the minute before the burst, the visible bids within ten basis points of the midpoint held roughly $253,600. The lowest one-second reading in the next seventy seconds was $502.
That is a 99.8% drop in near-price displayed depth. The book crossed halfway back from its trough in about 2.1 seconds.
Five hours later, a smaller burst produced a different market. Net aggressive selling came to $10.99 million. Near-price depth fell from about $376,900 to $2,349—and needed 106 seconds to cross the same halfway mark.
Two sell waves. One asset. Two clocks.
A price chart preserves the fall. A book snapshot preserves the hesitation around it. The distinction matters: the last trade is one receipt, while depth is a row of offers that can shift as the midpoint moves. Our question is not only how much traded, but how much buying interest stayed within reach while the price was moving.
Liquidity did not “come back” at one universal speed. The useful question is not whether the book was liquid. It is how much remained near the price, how quickly that amount changed, and how long it took to return.

A half-life, with the physics removed
In physics, half-life is the time it takes for a quantity to fall by half. Markets are less tidy: the book can refill, get hit again, move with the price, or stay thin. There is no single decay curve to fit and no universal constant hiding in the data.
So we use “half-life” as an operational question. After a sell shock pushes visible bid depth to a trough, how long until it regains half the distance between that trough and its pre-shock level—and stays there for ten consecutive one-second observations?
For example, if depth falls from $200,000 to $20,000, the halfway level is $110,000. We start the clock at the trough. A quick touch does not count: the book must hold above that halfway line for ten observed seconds.
It is a deliberately narrow measure. It tells us about the return of visible bids near the current midpoint, not the time needed for the whole market to recover, for price to return, or for a particular order to fill.
We watched three books for 48 hours
The sample runs from 00:00 UTC on 14 November to 00:00 UTC on 16 November 2026. We followed Binance Spot BTCUSDT, ETHUSDT and SOLUSDT: 48 hours, roughly 172,800 expected one-second book snapshots per asset, plus aggregated taker trades.
We selected ten-second windows from the most extreme positive net-sell observations: the 99.5th percentile of positive net aggressive selling, with sellers responsible for at least 55% of traded notional. To keep one prolonged wave from becoming many “events,” selected bursts were separated by at least two minutes.
That left 30 BTC, 27 ETH and 28 SOL events. This is a focused event study, not a random sample of ordinary trading.
For each event, we compared the median bid notional in the preceding 60 seconds with the lowest one-second reading from 10 to 70 seconds after the burst began. We counted depth within 10 bps of the live midpoint, using only the top 20 visible levels. Then we timed the sustained halfway recovery, with a five-minute observation limit.
Three assets, three recovery profiles
| Binance Spot | Selected sell bursts | Median near-price depth drawdown | Median time to sustained half-recovery | 75th percentile | Still unrecovered at 5 min |
|---|---|---|---|---|---|
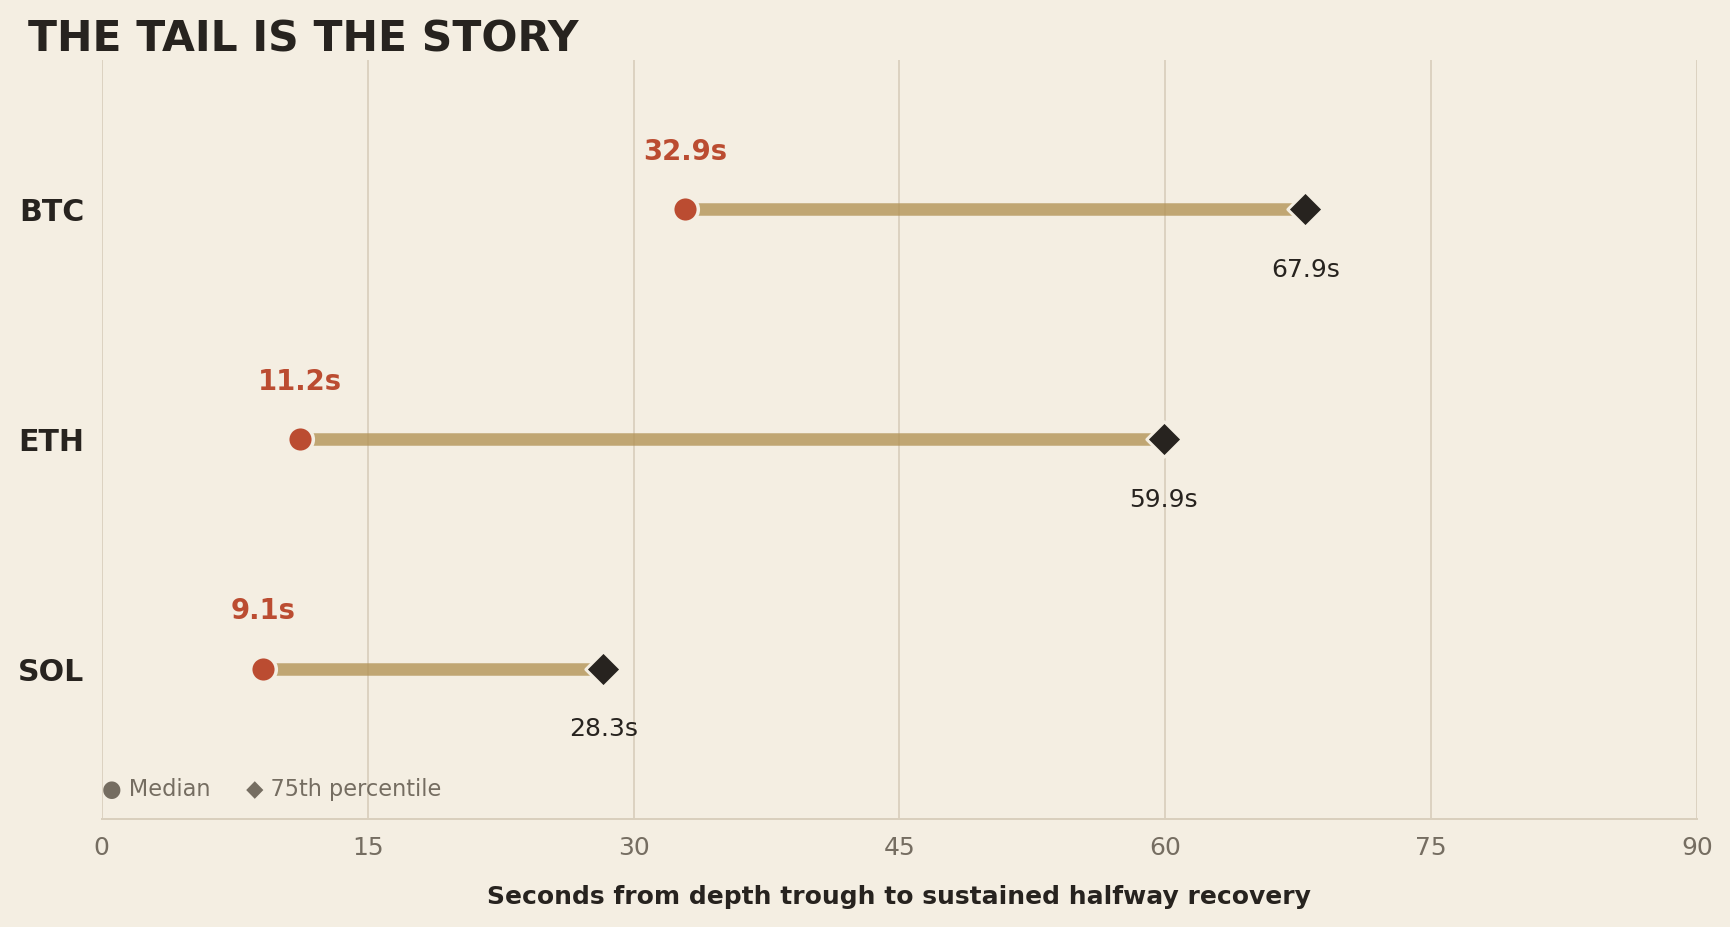
| BTC | 30 | 99.0% | 32.9 sec | 67.9 sec | 1 |
| ETH | 27 | 96.7% | 11.2 sec | 59.9 sec | 2 |
| SOL | 28 | 55.3% | 9.1 sec | 28.3 sec | 1 |
Those median times invite a quick ranking: ETH and SOL refill faster than BTC. The upper quartile complicates that story. Three quarters of measured ETH recoveries crossed halfway within a minute, but the median was only eleven seconds. A handful of slow events stretch the tail. BTC’s middle event recovered in 33 seconds; its slower quarter took more than a minute. The typical event and the difficult event are not the same event.
SOL’s depth loss was smaller in this ten-basis-point measure. Widen the lens to 25 bps and its median drawdown drops to 45.0%; two of 28 events no longer meet our 20% depletion threshold. The answer changes with the ruler. That is not a flaw in the data—it is a reminder that “liquidity” always needs a distance from price attached to it.
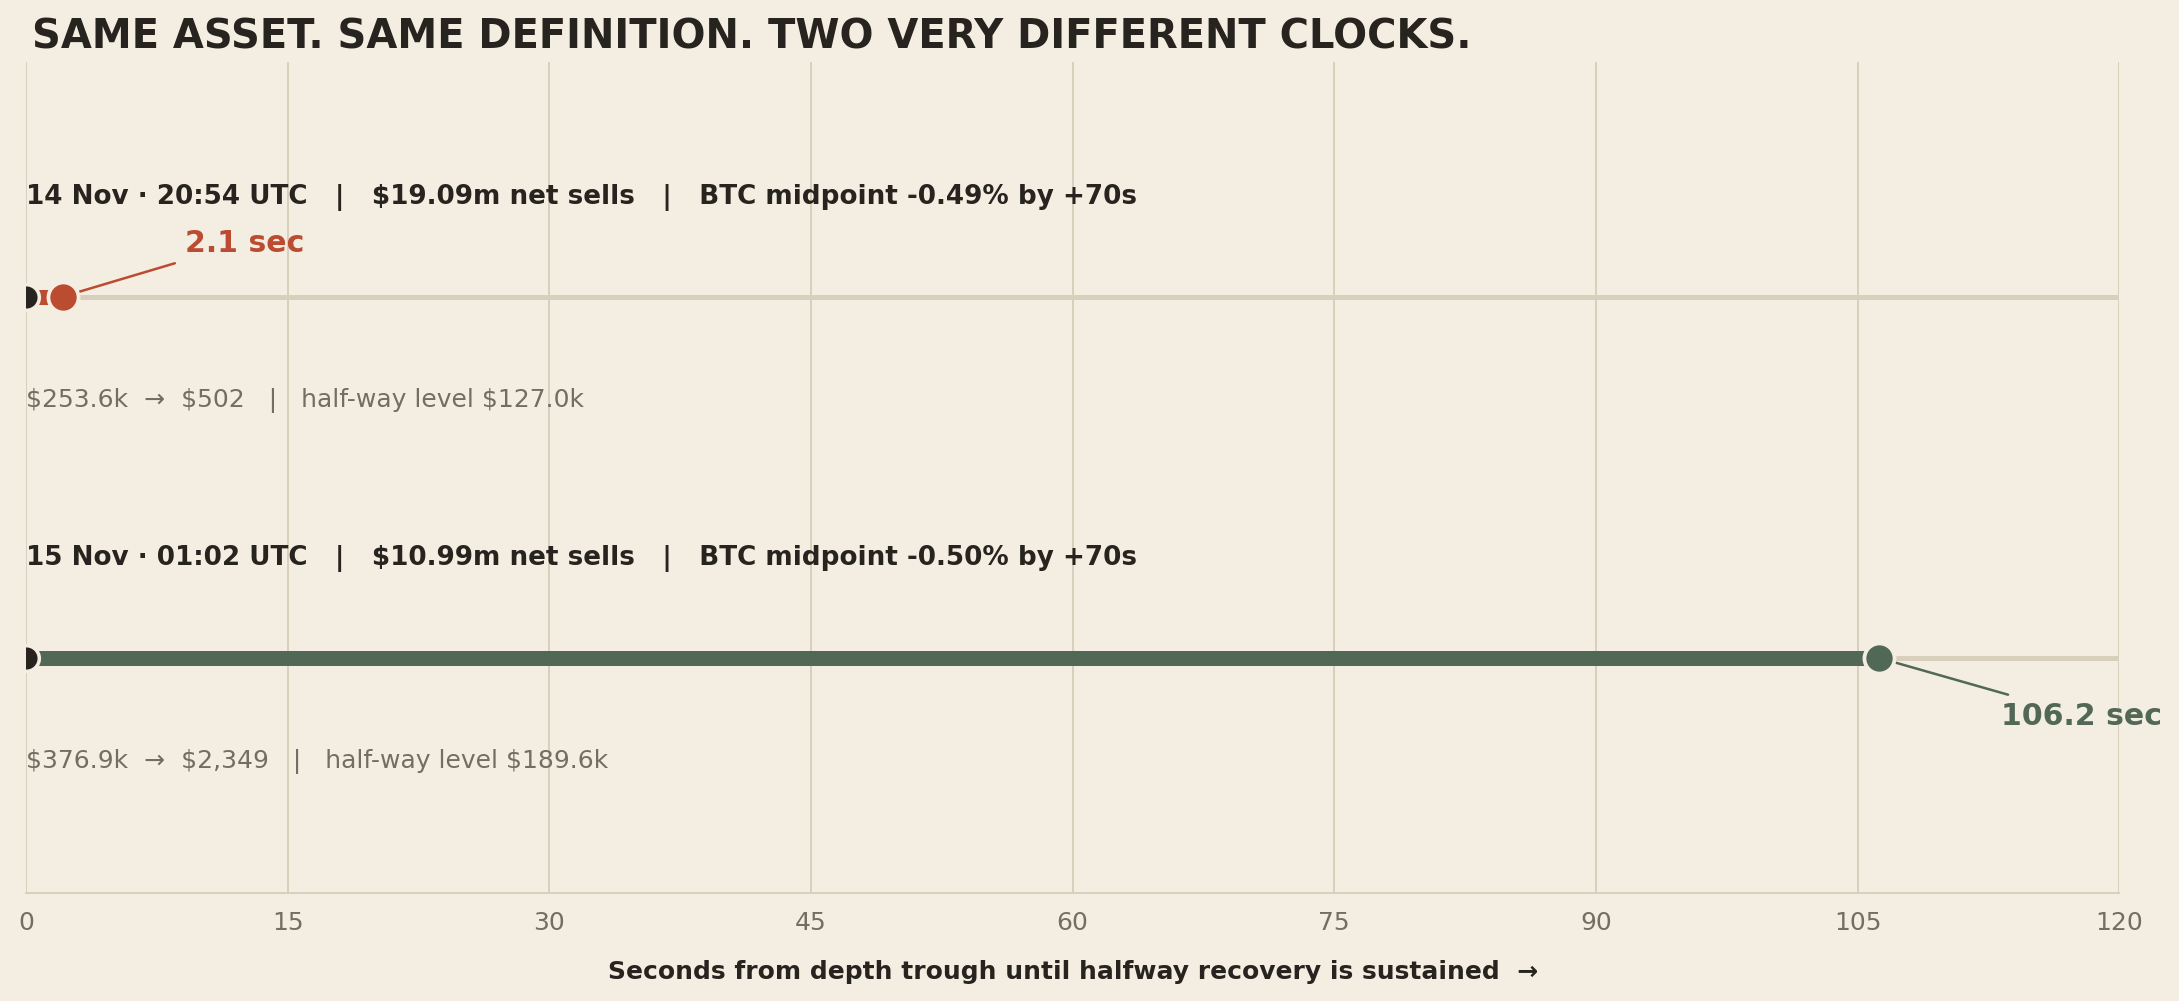
The contrast is sharper than the prices: by the 70-second mark, the midpoint in both BTC examples sat about half a percent below its prior-minute median. Yet one book crossed halfway in two seconds; the other took 106. Similar price moves came with very different refill schedules. These observations still cannot tell us whether missing orders were cancelled, consumed, repriced or pushed outside the chosen band.
A price can recover before a book does
Market resiliency has more than one clock. The spread can narrow while displayed size is still rebuilding. A price can bounce even though the nearby book remains shallow. Conversely, bids can return while price keeps falling.
That separation appears in academic work on limit order books. Clapham, Haferkorn and Zimmermann study resiliency after large market orders and distinguish spread recovery from depth replenishment; in their sample, the two did not move on the same timetable. Cont, Kukanov and Stoikov show why order flow must be read alongside depth: short-horizon price impact is related to order-flow imbalance and inversely to available depth. Our study measures neither their full order-flow imbalance nor their causal mechanism. It asks a smaller question: what did the visible bid near the live price look like after a burst of aggressive selling?
That distinction matters because a thin top of book is not the same thing as an empty market. The visible levels can be replaced, the midpoint can move, and fresh liquidity can appear farther away. A one-second top-20 snapshot catches some of that motion; it misses orders deeper in the book, hidden size, other venues, and the path between observations.
Why “the liquidity came back” is too simple
A single recovery number compresses three separate forces:
- Execution: sell orders consume resting bids.
- Repricing: quotes move as the midpoint and perceived risk move.
- Replenishment: new bids arrive, sometimes at the old price, sometimes farther away.
Our feed sees the resulting visible book and the aggressive trades. It does not let us label every missing dollar as a cancellation or every returning dollar as a new market maker. So the 99.8% BTC reading is not a claim that 99.8% of all Bitcoin liquidity vanished. It means that, in the recorded top 20 levels, the dollar value of bids inside a moving ten-basis-point window was briefly almost absent.
The moving window is useful: it asks how much bid support stayed close to the price traders could actually see at that moment. It is also sensitive to price movement. If the midpoint travels, old bids can fall outside the band without being cancelled. We therefore read depth loss together with price—not as a stand-alone cancellation counter.
This is why “half-life” is a vivid label, not a market constant. It changes with the width of the band, the sampling interval, the shock definition, the venue, and the event itself. In our sample, BTC produced both a two-second rebound and a 106-second wait. A median gives the center. The spread between those two stories is the research result.
The next question is capacity
The practical lesson is not “trade faster.” It is that a displayed book is a temporary offer of immediacy. Its usefulness depends on the size you need, your distance from the midpoint, and whether the market is absorbing flow or stepping away from it.
For a larger study, the next step is to move from snapshots to a reconstructed event book: include full depth updates, distinguish executions from cancellations and new limit orders, measure spread and depth separately, and compare several venues. Then repeat across quiet and stressed weeks—not just one volatile weekend.
Until then, the most honest answer is also the most interesting: after a hard sell, the market can look empty and refill almost at once. Or it can take almost two minutes. The clock is part of the price.
A market is not liquid because the screen is full. It is liquid for as long as the next bid survives the next seller.
The ruler behind the headline
“Net aggressive selling” is sell-taker notional minus buy-taker notional in each ten-second bucket. We marked a candidate only when that net value was positive, at or above the 99.5th percentile of positive net-sell buckets, and sell takers accounted for at least 55% of total notional. Candidates were ranked by net amount; the selected events were kept at least 120 seconds apart.
At each one-second book snapshot, we added the dollar value of visible bids priced no more than 10 bps below the live midpoint. The baseline is the median of the preceding 60 seconds. The trough is the minimum observed value from 10 to 70 seconds after the sell window starts. Halfway is trough + 0.5 × (baseline − trough). The clock stops at the beginning of the first ten-snapshot run above that level, or at five minutes after the trough. A snapshot gap longer than 2.5 seconds breaks a run. Unrecovered cases are censored, not assigned a five-minute recovery time.
Sources & method
- Primary market data: internal capture of public Binance Spot
aggTradeand partial-depth streams for BTCUSDT, ETHUSDT and SOLUSDT. Binance documentsaggTradeas aggregated taker-order trade data and the partial-depth stream as the top 5/10/20 levels, updated every second or 100 ms. Binance Spot WebSocket market streams. - Benjamin Clapham, Martin Haferkorn & Kai Zimmermann, “Does Speed Matter? The Role of High-Frequency Trading for Order Book Resiliency,” The Journal of Financial Research 43(4), 2020. Open PDF · DOI.
- Rama Cont, Arseniy Kukanov & Sasha Stoikov, “The Price Impact of Order Book Events,” Journal of Financial Econometrics 12(1), 2014. DOI · arXiv.
¹ Percentiles are calculated among events that recovered within five minutes; unrecovered events are shown separately.
¹ Depth is cumulative bid notional within 10 bps of the live midpoint, limited to the visible top 20 levels. ² Recovery percentiles use events that recovered within five minutes; unrecovered events are listed separately.
Limits. A single 48-hour window; one centralized spot venue; three USDT pairs; top-20 partial depth at roughly one-second cadence; mid-relative depth band; sample selected for extreme net selling. Not a universal recovery law, a full-book liquidity estimate, causal attribution, investment advice or a result of any Slyce trading strategy.