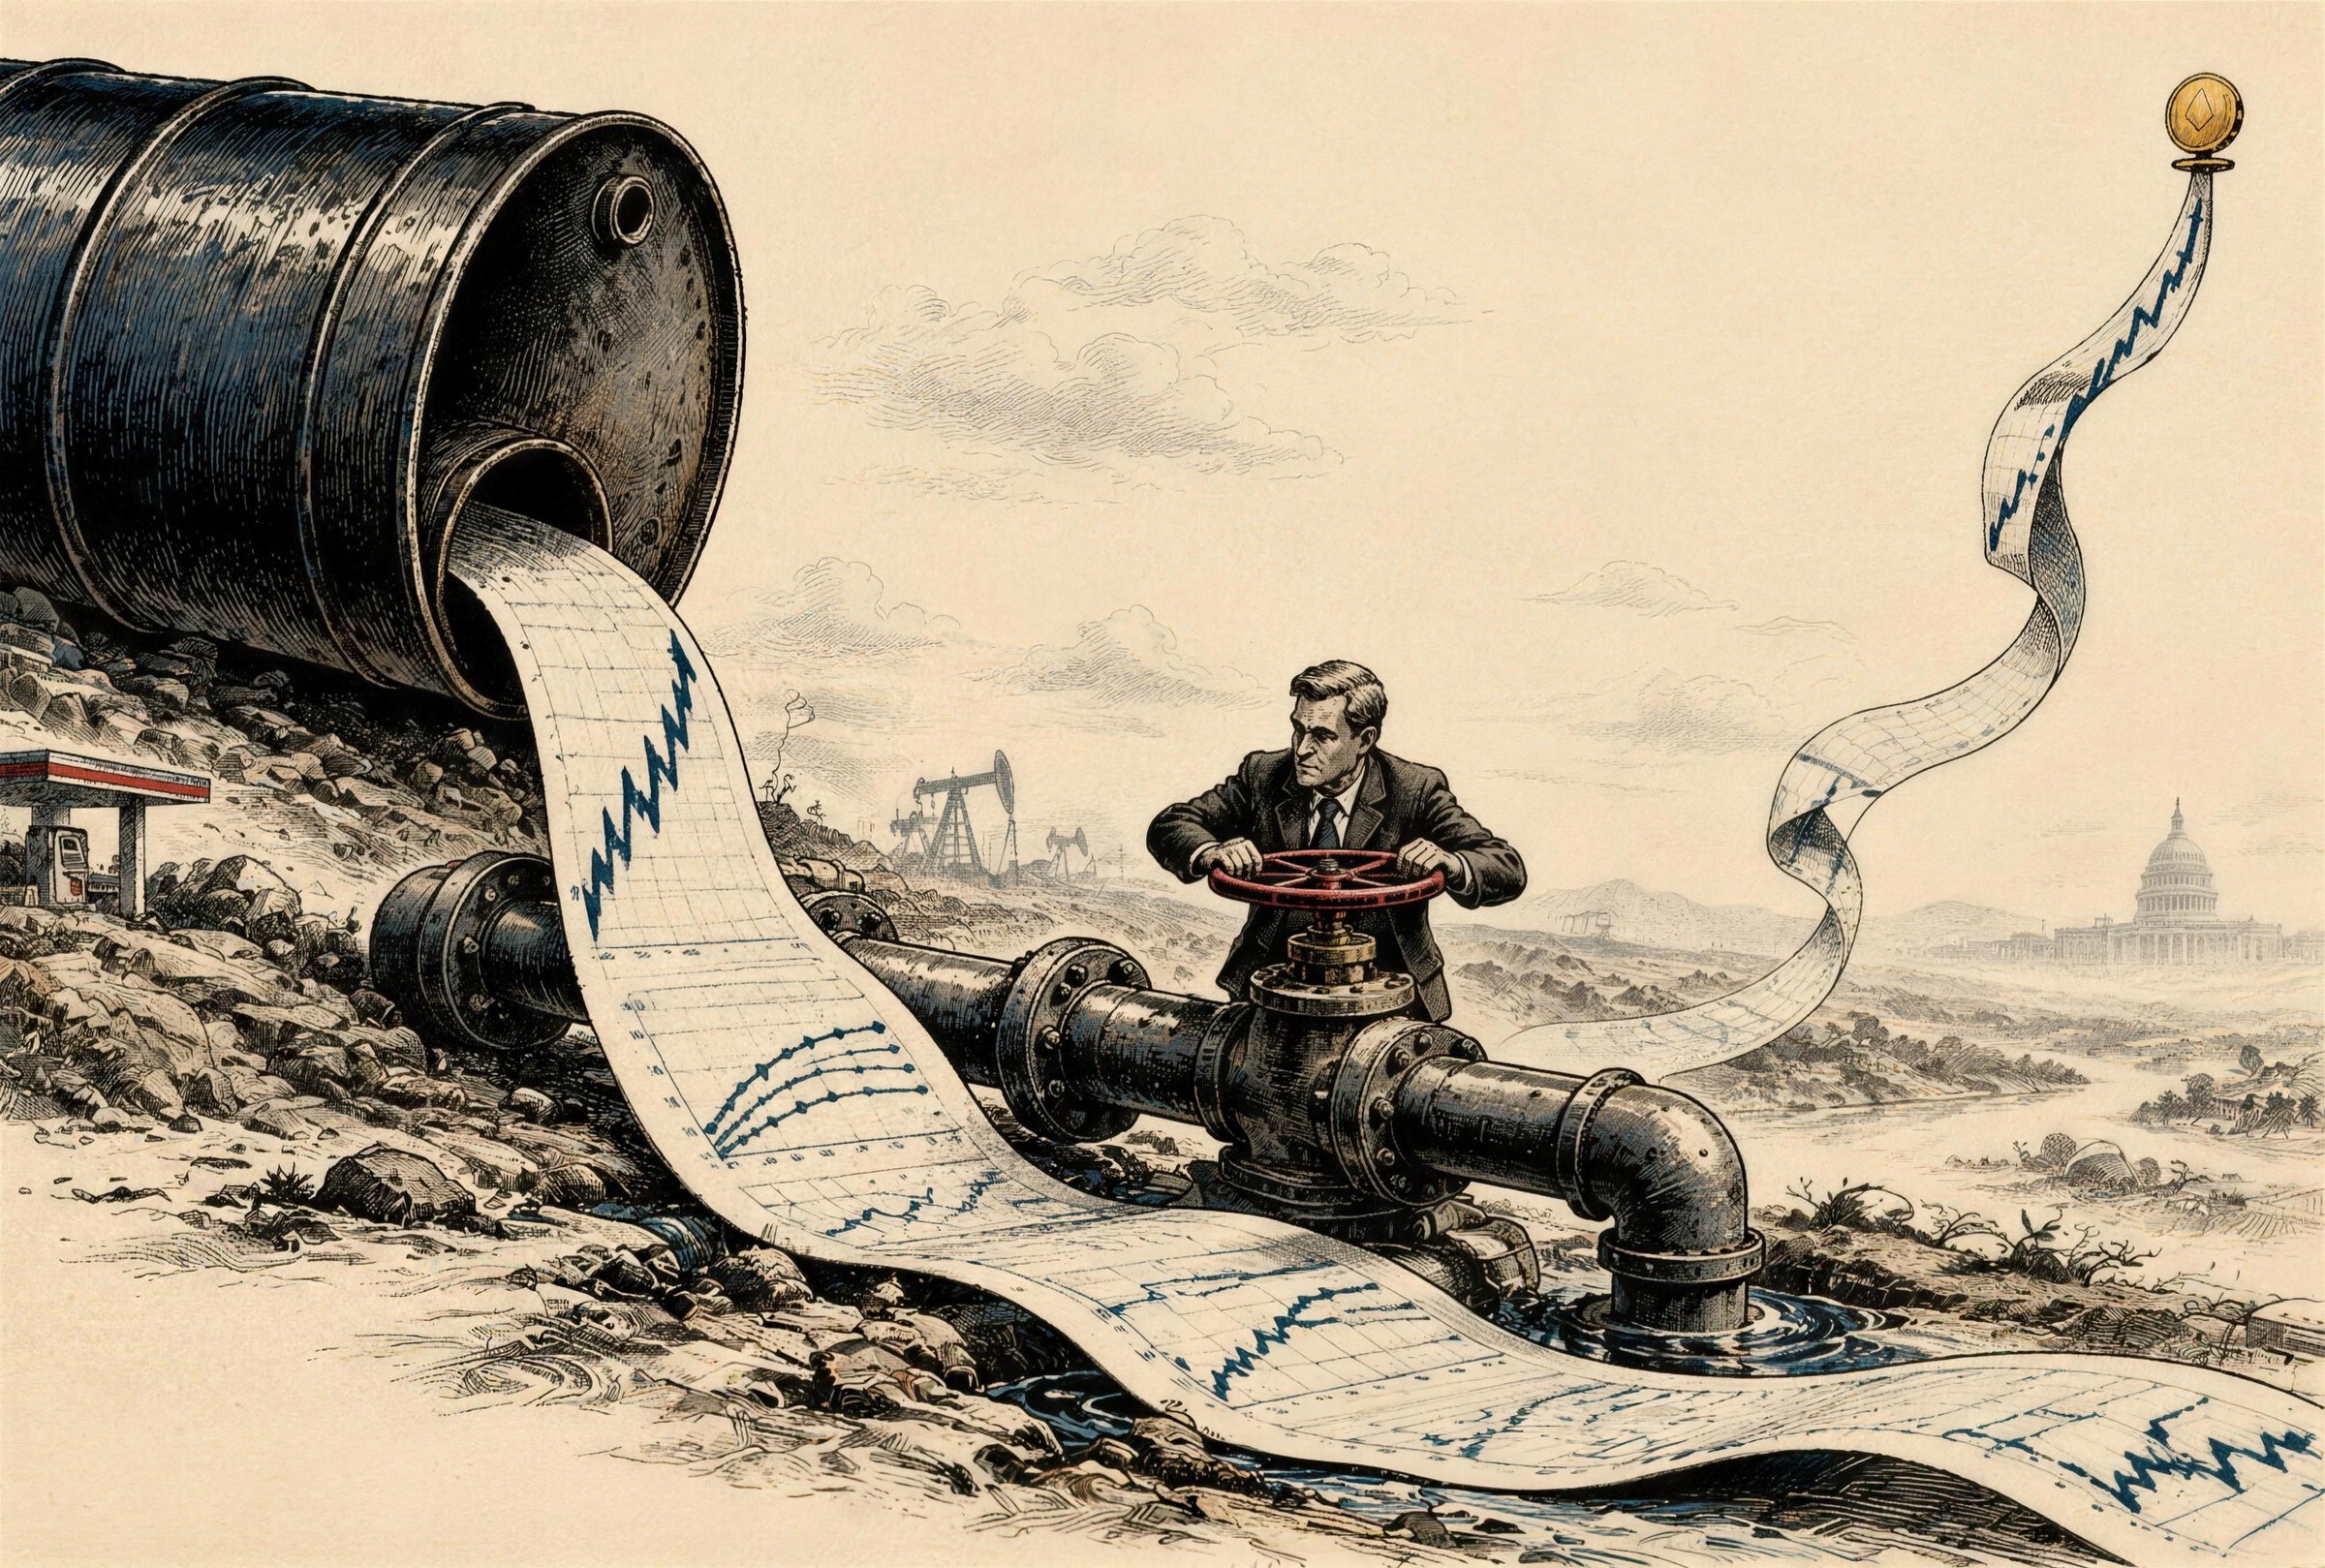
By Roman S. A thesis piece about the price of money, not a forecast.
There are weeks when Bitcoin seems to trade on crypto.
This is not one of them.
Washington is approaching a consequential vote on the CLARITY Act, a bill that could remove some of the regulatory ambiguity that has followed digital assets for years. Bitcoin has recovered from roughly $60,000 in late August to above $70,000. ETF flows have improved. Options traders are again entertaining higher strikes. A reasonable observer could look at the screen and conclude that the next important move belongs to Congress. [1]
The bond market is looking somewhere else.
On September 14, the ten-year US Treasury yield crossed 5% for the first time since 2023. Brent crude was trading around $108. Eighty-five percent of economists in a Reuters poll expected the Federal Reserve to raise rates by 25 basis points at its September 15–16 meeting, a sharp reversal from the hold that had until recently looked like the base case. Futures were beginning to price a tightening cycle that could extend well into 2027. [2]
These are not separate stories.
They are one transmission mechanism.
And for Bitcoin over the next few weeks, the barrel may matter more than the bill.
Two things can be bullish at once, on different clocks
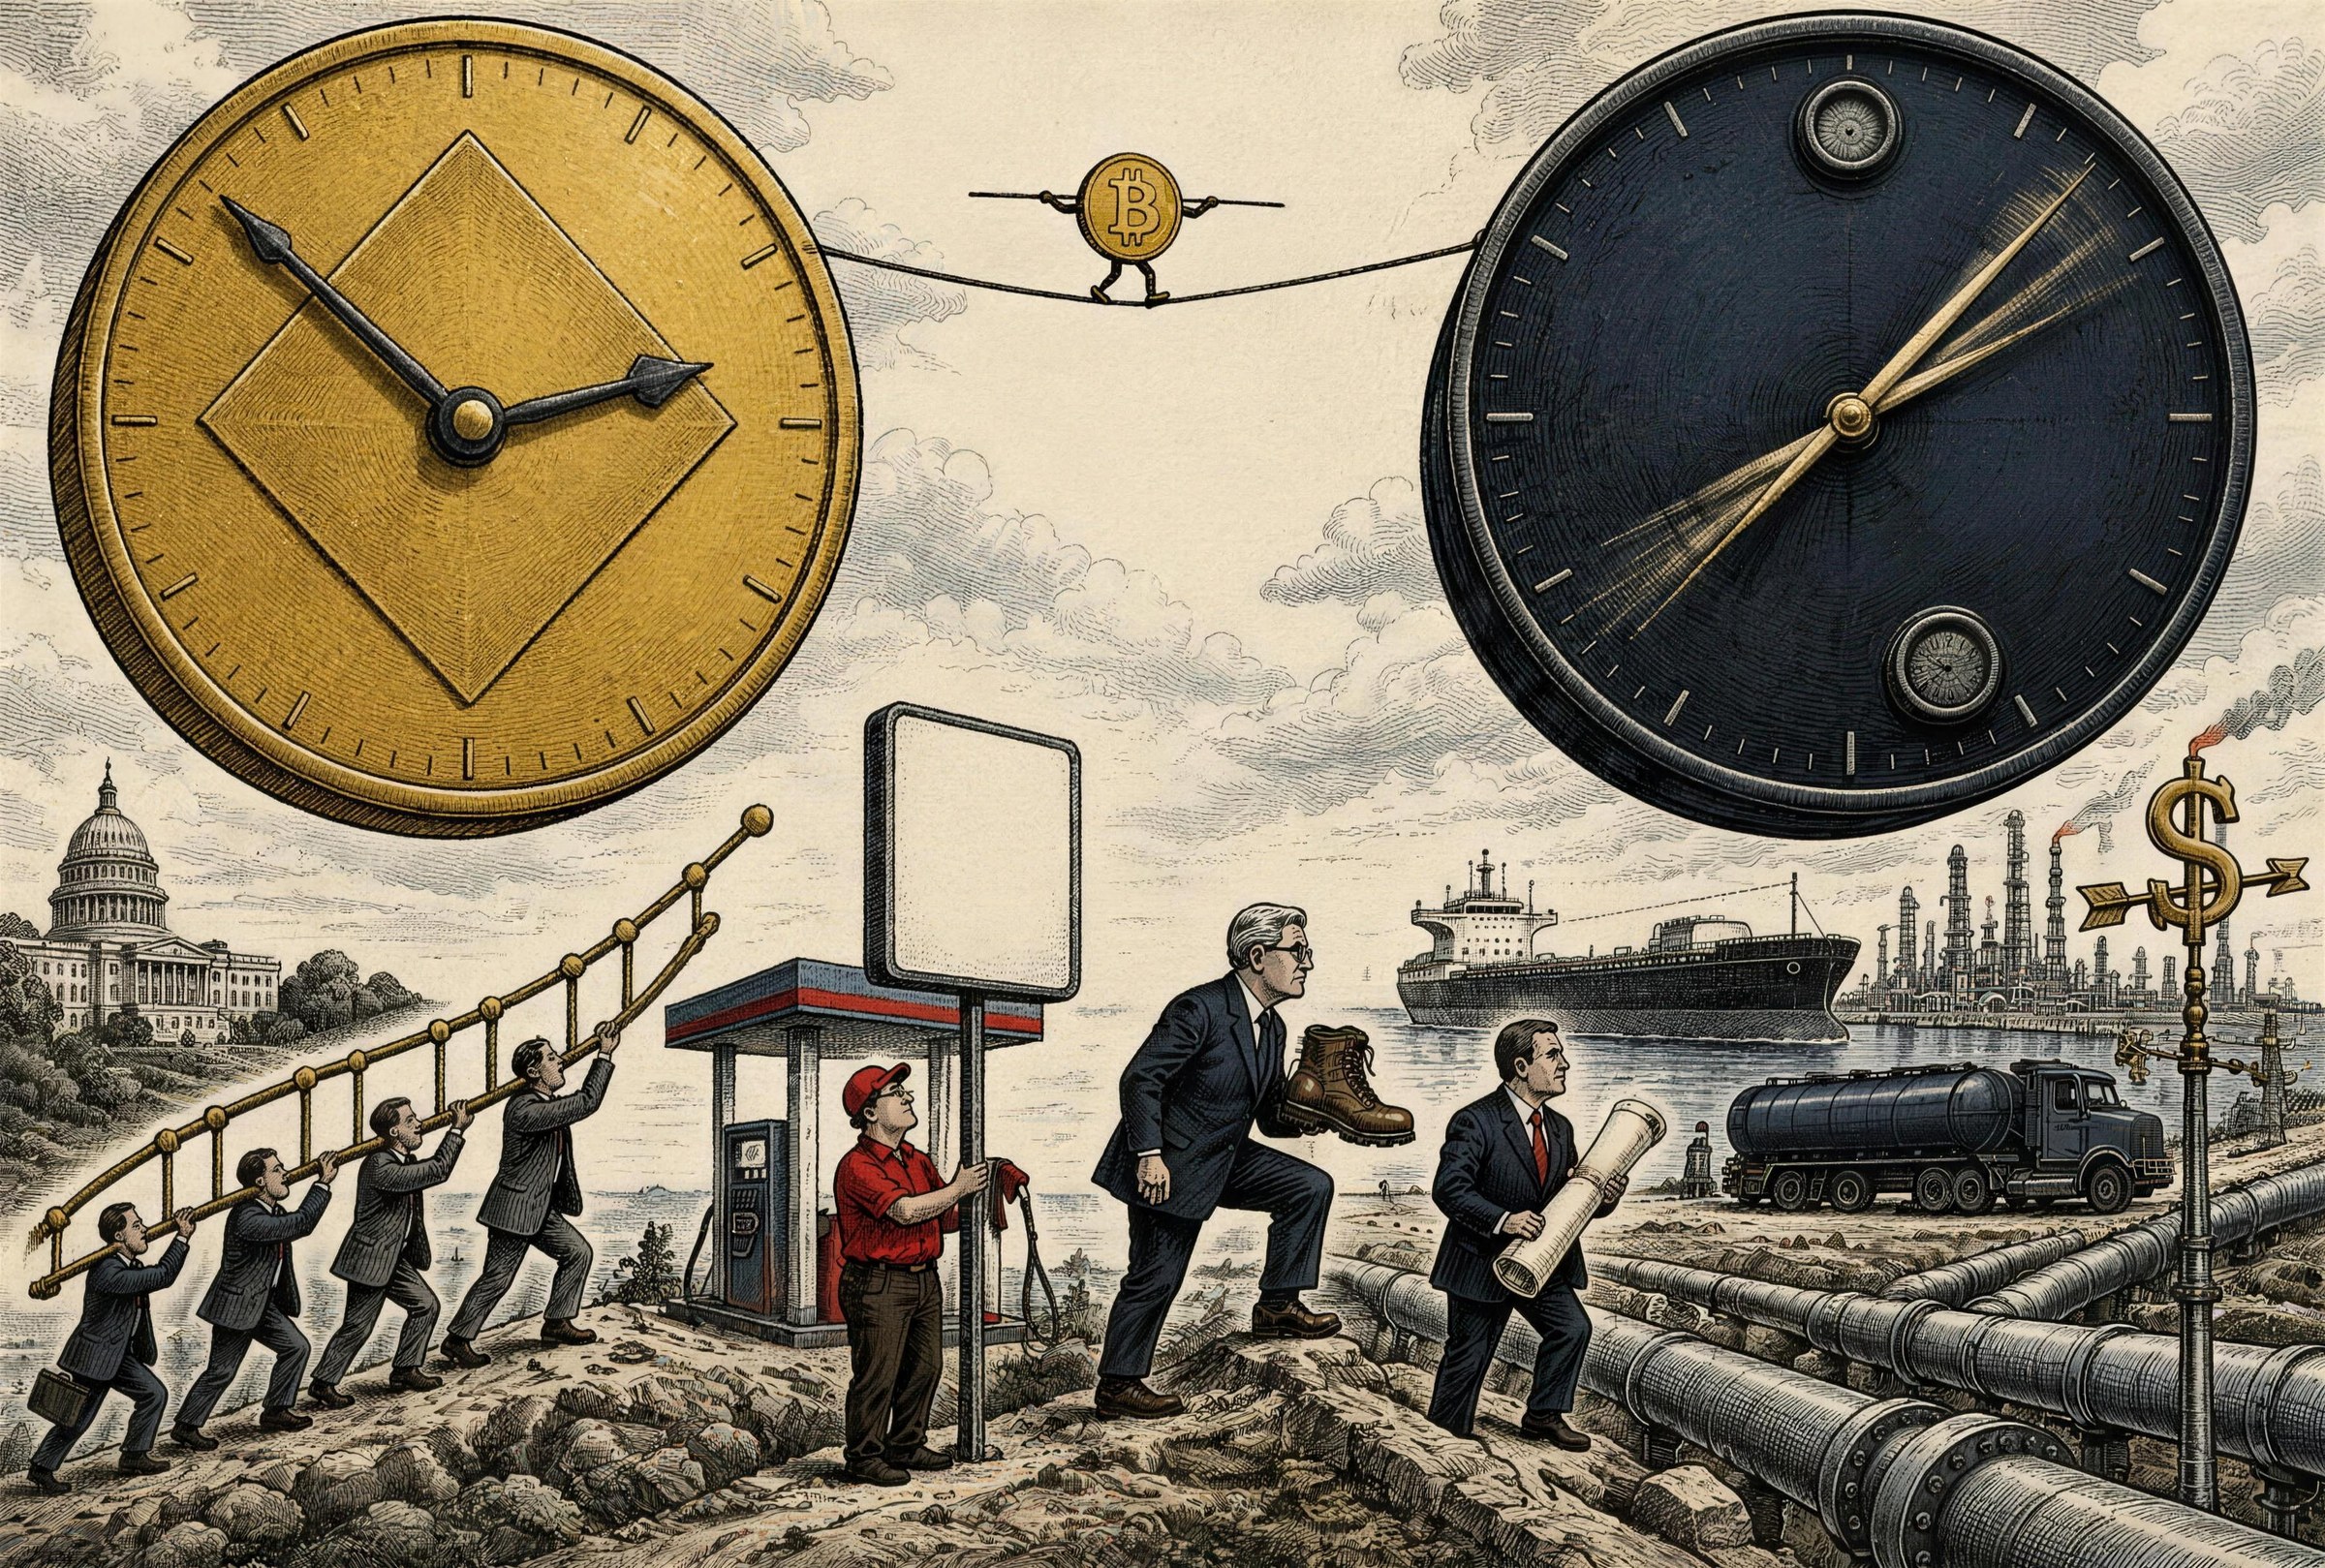
The useful way to think about CLARITY is not that it makes Bitcoin "go up."
It changes the asset.
Clearer rules can reduce legal uncertainty, widen institutional access, lower the cost of participation and remove part of the regulatory discount that investors attach to crypto. If the legislation works as intended, some amount of risk premium that exists because nobody is quite sure where the legal perimeter sits should become smaller.
That is structurally bullish.
Oil works through a different channel.
It does not primarily change what Bitcoin is. It changes the price of money around Bitcoin.
That distinction matters.
A better regulatory regime can make an asset more investable at exactly the same moment that higher interest rates make every risky asset more expensive to own.
Put differently:
The law changes the asset. Oil changes the discount rate. Over short horizons, the discount rate usually gets the first vote.
The mistake is to combine both effects into a single word, bullish, and assume they must arrive on the same candle.
They do not.
The long road from a barrel to a bitcoin
The route looks something like this:
Brent rises
→ gasoline and transport costs rise
→ headline inflation becomes stickier
→ inflation expectations adjust
→ the expected Fed path moves higher
→ Treasury yields reprice
→ the dollar and financial conditions tighten
→ leverage becomes more expensive
→ the required return on risky assets rises
→ Bitcoin gets a harder discount rate.
None of these arrows is mechanical. Each can weaken, reverse or be overwhelmed by another variable.
That does not make the chain useless.
It makes it a market.
The first link is already visible.
Energy currently carries a 7.347% relative importance in the US consumer-price index. Gasoline alone accounts for 3.770%. In August, the energy index was already up 16.3% from a year earlier and gasoline was up 27.4%. Gasoline then rose another 3.9% in August on a seasonally adjusted monthly basis. [3]
This is why an oil shock at $108 is different from a newspaper headline about an oil shock at $70.
The shock has entered the basket.
It is already being paid at the pump.
And once a price enters household inflation, the Federal Reserve no longer gets to discuss it only as a geopolitical curiosity.
The price Americans can see
Gasoline has two weights. One is inside the CPI basket. The other is inside people's heads.
The first weight is 3.770. The second is not published, but it is visible from the road. Gasoline is one of the few prices in the economy displayed in numerals a foot high, on every corner, updated daily, and paid in a single transaction large enough to notice. Most of the basket is paid in fragments. Rent arrives once a month and rarely changes. Insurance renews once a year. Gasoline is bought weekly, in full view, with last week's price still in memory.
It would be surprising if households weighted gasoline the way the Bureau of Labor Statistics does. An oil shock therefore acts through two channels at once: through the basket, where its weight is fixed and small, and through salience, where its weight is whatever the driver feels at the pump. Household inflation expectations can move out of proportion to gasoline's share of spending because the pump is the part of inflation people can see.
Central banks care about this because expectations are an input to the inflation process, not only a description of it. A household that expects prices to keep rising asks for a raise sooner and accepts a price increase with less resistance. A firm that expects its costs to keep rising raises its own prices ahead of them. The shock can propagate through behaviour before it propagates through the accounting.
The same salience runs in reverse. When gasoline falls, expectations can ease faster than the basket does. The pump is the loudest instrument in the inflation orchestra, in both directions.
The arithmetic is simple. The transmission is not.
The first-order intuition is tempting:
But crude oil is not the CPI energy basket.
Electricity does not move with Brent one-for-one. Natural gas has its own market. Refining margins change. Taxes are sticky. Retail gasoline moves with a lag. Freight contracts reprice on different schedules.
Gasoline gives us a cleaner approximation:
Suppose, purely illustratively, that a sustained move in Brent from around $100 to $120 eventually produces another 10–15% increase in retail gasoline relative to the path it otherwise would have followed.
The mechanical arithmetic is:
That is roughly 0.38–0.57 percentage points of price-level pressure relative to the no-shock counterfactual, before timing, substitution and pass-through effects.
It is not a forecast that the next CPI print suddenly rises by half a point.
The point is more modest and more useful: a large enough gasoline shock is no longer small relative to the inflation rate the Fed is trying to control.
And gasoline is only the direct channel.
Jet fuel moves. Trucking moves. Freight moves. Plastics, chemicals and agricultural inputs move. Consumers see the number every time they fill the car. Inflation expectations can change before the full cost pass-through reaches the official index.
The barrel enters twice: once through arithmetic, then again through psychology.
The Fed cannot drill for oil
An interest-rate increase cannot produce a barrel of crude.
The Federal Reserve knows this.
What it can do is stop the first shock becoming a second one.
The distinction the Fed works with is between a relative-price shock and an inflation process. Oil at $108 is a relative-price shock: one input has become more expensive against everything else, and the arithmetic above is roughly the size of it. Left alone, a relative-price shock passes through the index once and drops out of the year-over-year comparison twelve months later. It is painful, and it is arithmetic.
An inflation process is what happens when the first shock changes behaviour. Wages reprice to catch up with the pump. Services raise prices because their inputs did. Firms discover that customers will accept an increase, and keep taking it. Expectations stop anchoring to the target and start anchoring to last month's print. At that point the shock has left the energy line of the CPI and moved into the rest of the basket, and there is no base effect waiting to wash it out.
The Fed reacts to the probability of that transition, not to the barrel. This is why its reaction function looks different in different years. The same twenty-dollar move in crude is treated as noise when expectations are anchored and the labour market is loose, and as a threat when the previous shock has barely cleared and wages are still catching up. With the energy index already up 16.3% on the year and gasoline up 27.4%, the second-round question is no longer hypothetical. It is the question.
The Fed does not have to defeat the oil shock. It has to prevent the oil shock from teaching the rest of the economy how to raise prices.
A 25 basis-point increase does nothing to the barrel. It works on what the economy does with the barrel.
The bond market has already noticed
A ten-year yield above 5% is not an oil price with a maturity date.
It reflects growth, fiscal deficits, Treasury supply, corporate issuance, term premium, inflation expectations and the expected path of policy rates. Reuters has specifically pointed to heavy bond supply and fiscal concerns alongside inflation and oil in explaining the latest selloff. [4]
That qualification matters.
It also makes the current setup more interesting.
Oil is not hitting a calm duration market. It is hitting a bond market that was already asking to be paid more.
The Fed side is more direct. A majority of economists had previously expected policy to remain unchanged through 2026. After the latest inflation data and the move in oil, major banks shifted toward a September hike. The Reuters poll published Sunday put 85% of economists on a quarter-point increase this week, while futures were pricing the possibility of several further hikes through next summer. [2]
That change is the thing crypto has to trade through.
Not the barrel by itself.
The repricing of money caused by the barrel.
Not all five-percent yields are the same
A Treasury yield is a price with an anatomy.
The standard decomposition of a ten-year nominal yield has three parts: the path of real short-term rates the market expects the Fed to deliver over the decade, the inflation it expects over the same period, and a term premium, the extra compensation investors demand for holding a ten-year claim instead of rolling short bills. The term premium moves with uncertainty and with how much duration the Treasury asks the market to absorb.
Oil pushes on the second part first: higher expected inflation, at least for the front years. The Fed's repricing pushes on the first: a higher expected real policy path. Deficits and Treasury supply push on the third, and Reuters' account of the latest selloff put heavy supply and fiscal concerns beside inflation and oil. [4] Today's 5% may be all three pressures at once, and the mix matters more than the level.
It matters because Bitcoin does not necessarily respond identically to every organ inside it. A yield that is 5% because the market expects a hawkish Fed and a strong dollar is the discount-rate story of this essay. A yield that is 5% because the market has stopped trusting the fiscal path is a different story. Term premium rising on fiscal doubt is the environment in which the monetary argument for a scarce asset gets louder, even while the cost of holding it gets higher. The two readings are not exclusive. They are, however, different reasons to sell, and one of them is also a reason to buy.
For Bitcoin, the question is not whether the ten-year is at 5.0. It is why.
What matters is what bonds think oil means
Oil does not automatically raise real yields.
A nominal yield can rise for two very different reasons. If Brent jumps and the market concludes that the Fed will tolerate the extra inflation, breakevens rise by more than nominal yields, and the real yield, the nominal minus expected inflation, falls. If instead the market concludes that the Fed will lean against the shock hard, nominal yields rise by more than breakevens, and the real yield rises.
The difference is the whole game for a long-duration asset with no cash flow. A falling ex-ante real yield with rising inflation expectations is the configuration in which scarce assets tend to be bid. A rising real yield with a strengthening dollar is the configuration in which they tend to be sold, whatever the inflation print says. The same barrel produces either, depending on what the rates market decides the barrel means for policy.
This is why the September setup is uncomfortable. The poll moved to a hike, futures price several more, the ten-year crossed 5% and the two-year is rising. The market is reading the shock as something the Fed will fight. That is the real-yield version, not the tolerance version.
For Bitcoin, "oil up" is not the signal. The signal is what the rates market decides the oil means.
Why Bitcoin behaves badly when money gets expensive
There are several competing descriptions of Bitcoin, and inconveniently, more than one can be true.
It is a scarce monetary asset.
It is a speculative asset.
It is an institutional portfolio allocation.
It is collateral.
It is a call option on a different monetary system.
And in shorter market windows, it is still a high-beta liquidity instrument.
The last description often wins first.
When risk-free cash and Treasuries yield more, an asset with no contractual cash flow has a higher opportunity cost. When real rates rise, long-duration assets are discounted more aggressively. When the dollar strengthens, global dollar liquidity becomes more expensive. When financing costs rise, leveraged positions become less attractive. When volatility arrives at the same time, balance sheets shrink.
None of this requires anybody to stop believing in Bitcoin.
That is the important part.
Bitcoin can become more compelling as a monetary argument while becoming less attractive as a financial position.
The thesis and the trade can move in opposite directions.
The fiat-debasement argument may become stronger if fiscal and monetary credibility deteriorate.
But a trader facing a margin requirement this Friday does not own a one-year philosophical horizon.
A leveraged fund does not get to tell its lender that the monetary thesis remains intact.
A risk committee marks the position today.
This is why Reuters can report two apparently contradictory facts at once: Bitcoin's recovery from around $60,000 toward the low $70,000s was helped by the earlier easing in Treasury yields, while renewed inflation and rising yields now threaten that same recovery. [1]
There is no contradiction.
The horizons are different.
If Bitcoin is digital gold, why does inflation hurt it?
The objection is obvious. Bitcoin was sold as an inflation hedge. Inflation is rising. Why is the hedge falling?
Gold has the same problem, and has had it for decades. Gold suffers in inflation shocks when the answer to the shock is sufficiently restrictive policy and rising real yields, because gold has no yield of its own and its opportunity cost is exactly the real rate the central bank is raising. Scarcity does not exempt an asset from opportunity cost. It only means the supply side will not bail out the holder.
An inflation hedge is not necessarily a hedge against the policy response to inflation.
Bitcoin adds its own amplifiers to the gold problem. It trades 24 hours a day, seven days a week, so it is the asset that reprices first when a Sunday-night headline lands. It carries leverage in a way gold rarely does: perpetual futures, margin loans, collateralised positions that liquidate mechanically at a price rather than at a decision. It sits on the balance sheets of funds whose lenders mark it daily. And its ownership is still weighted toward the part of the market most sensitive to global dollar liquidity. Each of these makes Bitcoin more responsive to the price of money than the monetary argument for it would suggest.
Bitcoin may hedge the long-run consequences of monetary disorder while selling off on the short-run attempt to contain that disorder. The two are not in conflict. They are on different clocks.
One asset, two repricings
It helps to write the argument down. What follows is a conceptual decomposition, not a valuation model.
RRP is the regulatory risk premium: the discount investors apply because the legal perimeter is uncertain. r is the real rate, USD the dollar, Liquidity the global supply of dollar funding, Positioning the leverage already in the system. CLARITY works on the first term: ΔRRP < 0. Oil, through the monetary channel, works on the next three: Δr > 0, ΔUSD > 0, ΔLiquidity < 0. Positioning decides how violently the others are expressed.
Nothing in that expression requires the first term to dominate. A bullish term (−ΔRRP) and a bearish term (Δr + ΔUSD − ΔLiquidity) can arrive on the same day and need not sum to a positive number. Whether they do depends on magnitudes nobody prints in advance: how much premium the law actually removes, and how far the rates market has already moved by the time the vote is counted.
Three barrels, three markets
It is useful to treat oil not as a Bitcoin price target, but as a regime variable.
| Brent regime | Inflation read | Rates implication | Likely BTC environment | Market state |
|---|---|---|---|---|
| ~$80 | Energy shock largely unwinds | Hikes can be removed from the curve; long yields have room to fall | Strongly supportive | Risk-on |
| ~$100 | Headline inflation remains sticky | Higher-for-longer remains credible | Difficult but tradable | Chop / volatile |
| ~$120 | Renewed inflation impulse | More tightening priced; long-end pressure likely persists | Poor near-term environment | Risk-off |
The yield levels inside each regime should not be read as deterministic outputs. Oil at $80 does not guarantee a 4.5% ten-year yield, just as oil at $120 does not mechanically produce 5.5%.
Fiscal supply can overwhelm it.
Growth can collapse.
Geopolitical de-escalation can change several variables at once.
The point of the table is not to forecast the ten-year.
It is to show why the same crypto headline lands differently in different macro states.
Good law. Bad tape.
Now put CLARITY back into the picture.
Imagine Congress delivers exactly the result crypto wants.
Regulatory ambiguity falls.
Institutional access improves.
A headline hits the tape:
CLARITY PASSES.
Bitcoin jumps 4%.
Then look one screen to the left.
Brent: $116.
US 10Y: 5.18%.
US 2Y: rising.
Dollar: rising.
Fed: another hike being priced.
What exactly has changed?
The asset got better.
The funding environment got worse.
There is no law of markets requiring the first effect to beat the second before lunch.
A plausible path is therefore:
regulatory headline
→ crypto reprices upward
→ event buyers arrive
→ early holders sell the event
→ macro conditions remain restrictive
→ rates regain control
→ most or all of the move disappears.
That would not mean CLARITY did not matter.
It would mean its effect was being capitalized into an asset whose discount rate was moving in the other direction.
This distinction becomes especially important because political catalysts are discrete.
A bill passes once.
Oil prices, inflation expectations, Treasury yields and the dollar clear every day.
One is an event.
The other is an environment.
Now reverse the barrel
The more interesting scenario may be the opposite one.
Assume some geopolitical settlement takes the risk premium out of crude.
Brent moves from around $108 toward $80–90.
Gasoline futures fall.
Expected headline inflation falls with them.
The market removes some future Fed tightening.
The front end rallies.
The ten-year falls.
The dollar softens.
Financial conditions loosen.
Then CLARITY passes.
Now the same piece of legislation arrives into a completely different machine.
The regulatory risk premium is falling while the discount rate is falling.
Instead of two forces fighting over the same asset, they point in the same direction.
That is not a three-percent headline candle.
That is the sort of configuration from which regime changes can emerge.
The distinction is worth making explicit:
CLARITY + $115 Brent is a catalyst.
CLARITY + collapsing oil + falling yields is a configuration.
Markets usually remember the second one longer.
Congress gets one vote. Markets vote continuously.
CLARITY is a discrete information event. It has a date, a roll call and a result. Once the result is known, the information is in the price, and the only thing left to trade is what the market got wrong about it.
Brent, Treasuries, the dollar and the expected Fed path are not events. They are continuous series. They clear every hour, they absorb every data release, and they do not stop because Congress has adjourned. A regulatory catalyst lives in event-time. The macro regime lives in clock-time.
This asymmetry is why the same bullish catalyst can look powerful for an afternoon and irrelevant for a quarter. Event-time gives a headline its candle. Clock-time decides what the candle is standing on.
Three times the macro clock won
The claim that the price of money can overrule the crypto narrative is not a theory. It has dates. Three episodes, with prices from the Coinbase series published by the St. Louis Fed and yields from the Treasury's constant-maturity series. [6] [7]
2020: liquidity withdrawn, then supplied without limit. On March 9, 2020, Bitcoin closed at $7,945. On March 12 it closed at $4,980, a fall of 37% in three sessions, in a week when the ten-year yield rose from 0.54% to 0.88% because even Treasuries were being sold for cash. [6] [7] Nothing in the protocol had changed. On March 23 the Fed said it would buy Treasuries and agency mortgage-backed securities "in the amounts needed to support smooth market functioning". [8] Bitcoin closed the year at $29,027. [7] The story that year was the halving and institutional adoption. The mechanism was dollar liquidity, first withdrawn and then supplied without limit.
January 2022: a paragraph, not a market. On January 5, 2022, the Fed released the minutes of its December meeting, which recorded that "it may become warranted to increase the federal funds rate sooner or at a faster pace than participants had earlier anticipated". [12] Between the January 3 and January 6 closes Bitcoin fell from $46,520 to $43,133, about 7%. [7] The catalyst was a sentence about the expected path of the policy rate.
2022: the tightening year. On March 16, 2022, the Fed raised its target range to 0.25 to 0.50%. On December 14 it raised it to 4.25 to 4.50%. [9] [10] The ten-year yield went from 1.63% on the first trading day of the year to a high of 4.25% in October and 3.88% at year-end. [6] Bitcoin went from $46,520 on January 3 to $16,606 on December 30, a fall of 64%, with a low of $15,756 on November 21. [7] Crypto had its own failures that year, and they were real. But the direction was set in the first quarter, before any of them, by the repricing of money. The CPI had its own oil chapter: in June 2022 the all-items index was up 9.1% on the year, with energy up 41.6% and gasoline up 59.9%. [11] The barrel was inside that inflation too.
When crypto won
The rule cuts both ways, and the counter-example is recent.
On January 10, 2024, the SEC "approved the listing and trading of a number of spot bitcoin exchange-traded product shares". [13] Bitcoin closed at $46,590 that day, sold off to $39,867 by January 23, and then rose to $73,098 on March 13, 2024, a record at the time, as the new funds absorbed demand. [7] [14] The ten-year yield rose over the same window, from 4.04% on approval day to 4.19% on the day of the record. It had closed at 4.98% on October 19, 2023, in the months before the decision, and Bitcoin climbed anyway, from $28,735 that day to $33,920 three sessions later, on October 24. [6] [7]
A sufficiently large change in access beat a five-percent yield. It also produced the sell-the-event pattern first: two weeks of decline before the structural bid took over.
Every asset has multiple discount rates. The question is which one the market is repricing fastest.
The four-screen test
For the next few weeks, a useful Bitcoin dashboard may contain surprisingly little crypto.
Brent.
The US two-year.
The US ten-year.
The dollar.
The two-year tells you what the market thinks about the Fed.
The ten-year tells you something broader: inflation, fiscal credibility, growth, supply and term premium.
The dollar tells you how tight the global financial system is becoming.
Oil helps tell you whether the inflation impulse feeding those variables is healing or worsening.
Now place Bitcoin beside them.
If Bitcoin rallies on a regulatory headline while Brent remains above $105, both Treasury yields are rising and the dollar is strengthening, the rally deserves skepticism.
Not because the legislation is fake.
Because the financial conditions are real.
If instead Brent breaks below $90, yields fall, the dollar weakens and regulatory clarity arrives at the same time, calling the resulting move another political pump becomes much harder.
Something deeper has changed.
The price of money changed with it.
Where this argument can be wrong
There is a seductive mistake in macro analysis: draw enough arrows and eventually the diagram starts to look like causality.
Reality is less polite.
Oil could fall because growth is collapsing, in which case lower yields may arrive with worse risk appetite rather than better. Bitcoin could decouple from duration because a sufficiently large regulatory or institutional shock dominates the rate effect. The dollar can strengthen for reasons that have little to do with the Fed. Long yields can remain above 5% even as inflation improves if fiscal supply and term premium become the larger story.
And Bitcoin's own market structure changes.
ETF ownership, collateral practices, derivatives positioning and institutional adoption can alter the sensitivity that appeared reliable in the previous regime.
That is why none of this is a Bitcoin forecast.
It is a hierarchy of questions.
The first question is not:
Will CLARITY pass?
It is:
What market will CLARITY pass into?
That is the distinction between a headline and a state.
The barrel behind the screen
Crypto likes stories in which crypto is the protagonist.
Sometimes it is.
This week, Congress matters. Regulatory structure matters. A successful CLARITY vote could remove uncertainty that has been sitting in the asset for years. That should not be dismissed simply because a bond trader is worried about gasoline.
But neither should the bond trader be dismissed because crypto finally got its law.
A five-percent Treasury yield is an offer.
A stronger dollar is a constraint.
An oil shock is an inflation input.
A Fed hike is a funding cost.
Bitcoin has to clear against all four.
That is why the strange possibility at the center of this week is not strange at all:
Bitcoin can become a better asset and fall in price at the same time.
The law works on what Bitcoin may become.
The barrel works on what capital costs today.
Until those two clocks point in the same direction, the second one may keep moving the tape.
Sources
- Reuters, 14 Sep 2026: Bitcoin's late summer rally set to face off against the Fed, Congress
- Reuters, 14 Sep 2026: Fed rate hike on Wednesday now likely, say economists, and at least one more to follow: Reuters Poll
- Bureau of Labor Statistics: CPI-U Table 2, August 2026 results
- Reuters, 14 Sep 2026: US 10-year yields reach 5%, highest since 2023
- Bureau of Labor Statistics: CPI News Release, August 2026
- Federal Reserve Bank of St. Louis, FRED: 10-Year Treasury Constant Maturity Rate (DGS10), daily closes.
- Federal Reserve Bank of St. Louis, FRED: Coinbase Bitcoin (CBBTCUSD), daily closes.
- Federal Reserve, 23 Mar 2020: Federal Reserve announces extensive new measures to support the economy
- Federal Reserve, 16 Mar 2022: FOMC statement
- Federal Reserve, 14 Dec 2022: FOMC statement
- Bureau of Labor Statistics: CPI News Release, June 2022
- Federal Reserve: Minutes of the FOMC meeting of December 14–15, 2021, released 5 Jan 2022.
- US Securities and Exchange Commission, 10 Jan 2024: Statement on the Approval of Spot Bitcoin Exchange-Traded Products
- Bloomberg, 13 Mar 2024: Bitcoin Tops $73,000 to Hit New Record On Insatiable ETF Demand
This is a thesis piece, not a forecast, and not investment advice. The companion argument, that politics changes the state of a market rather than its direction, is in The Apolitical Asset.